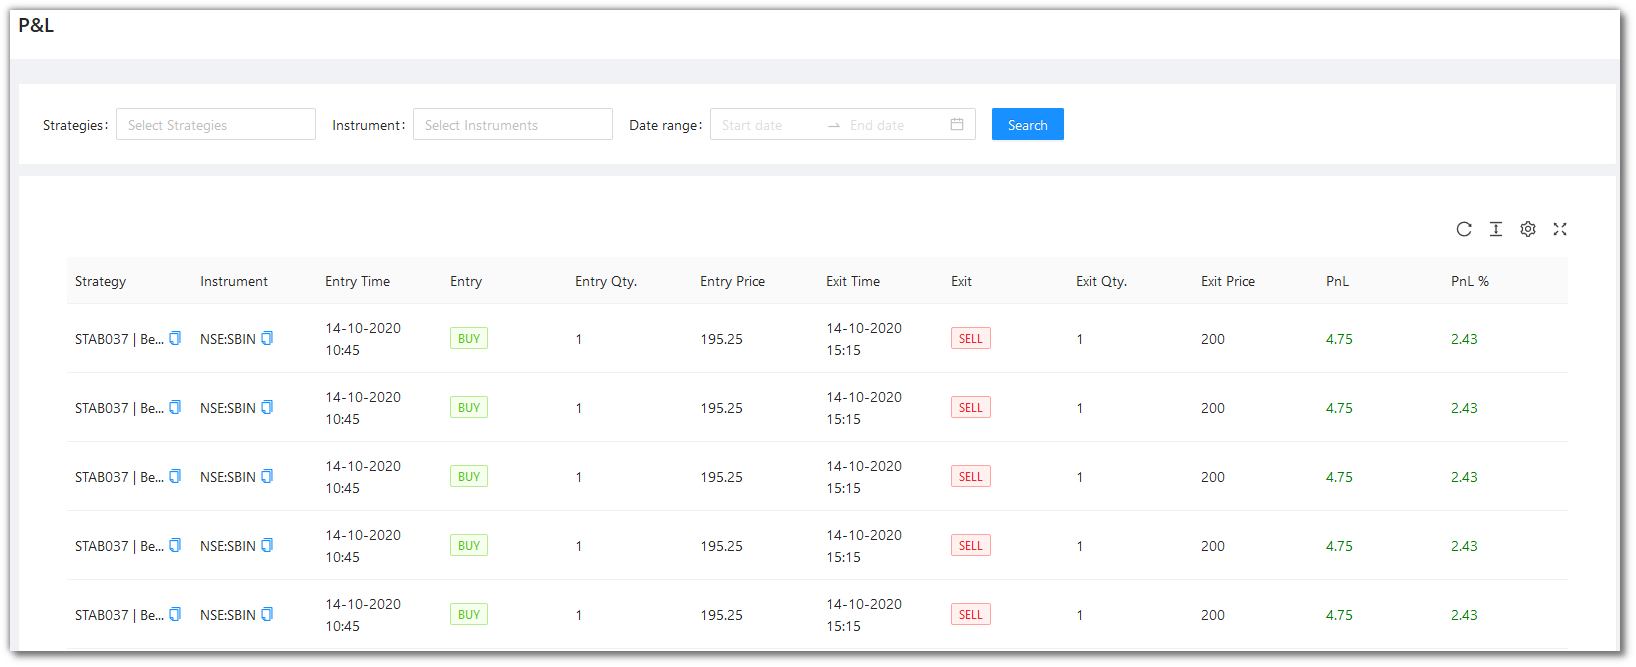
P & L (Beta)
This page shows the Profit and Loss of your trades in your account. All trades/orders in your account are updated real-time as and when the transactions take place. To get a better understanding, you can filter your activities using the filters, strategy, instrument and date range.
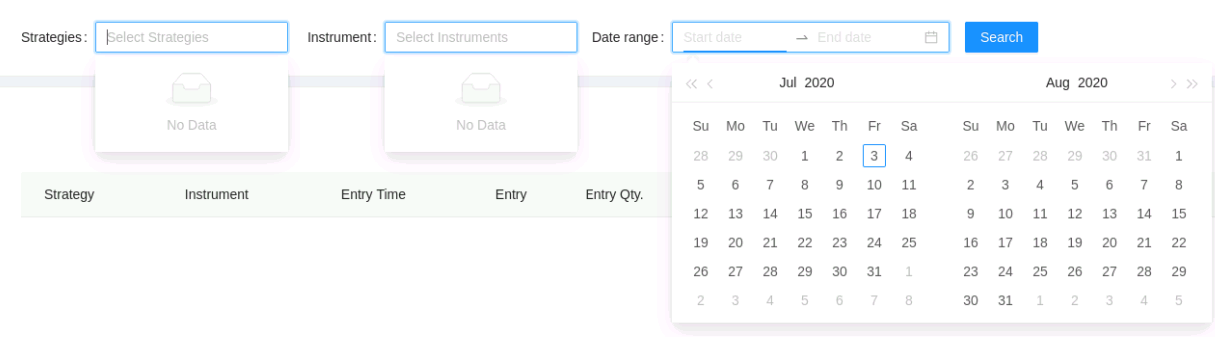
Filters
Filters will allow you to selectively search for a particular entry or entries.
-
Strategies- Choose one or more strategies to display them in the table below. These entries are populated as per the strategies opted/created by you. -
Instrument- Choose one or more instruments to display them in the table below. These entries are populated as per the instruments on which your strategies are fired on. -
Date Range- Give the date range to view the table for the selected strategy and instrument (if any)
Fields
The table covers the following fields:
Strategy- Name of the Strategy.Instrument- Instrument on which the backtesting was run.Entry Time- Entry Time of Trade.Entry- Entry Type of Trade.Entry Qty.- Entry Quantity of Trade.Entry Price- Entry Price of Trade.Exit Time- Exit Time of Trade.Exit- Exit Type of Trade.Exit Qty.- Exit Quantity of Trade.Exit Price- Exit Price of Trade.PnL- Pnl of the Trade.PnL %- Pnl % of the Trade.
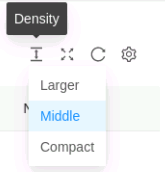
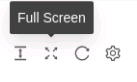
A look at the toolbar
Density - Choose the density of the data you see. Options are Larger, Middle and Compact
Full Screen - The current tab on your browser goes Full Screen. Click again to go back to normal. This is similar to pressing F11 on most browsers and operating systems.
Refresh - If you are not able to see an entry (possibly a most recent one) in the table, click Refresh to check again.
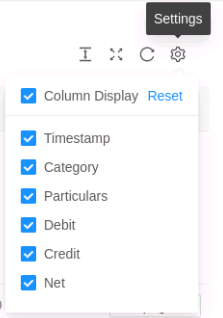
Settings - You can select which columns should be visible through here.
Tip: Press the Bell icon to see your most recent activities/events.